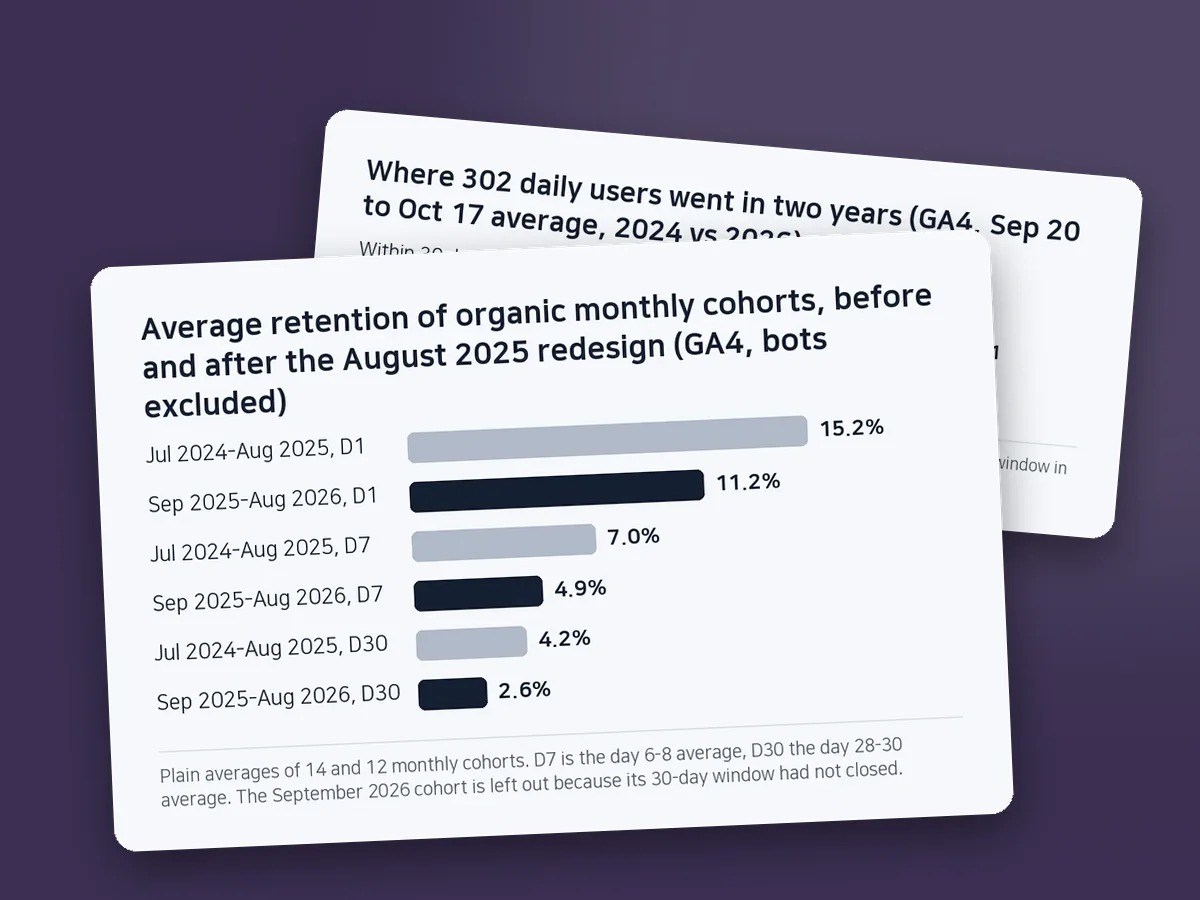
Daily users rose after the redesign while organic D1 retention fell from 15.2% to 11.2%
Day-1 retention of our spelling app's organic cohorts fell from 15.2% to 11.2% after an August 2025 redesign and has not come back in over a year. We have not pinned down the cause.
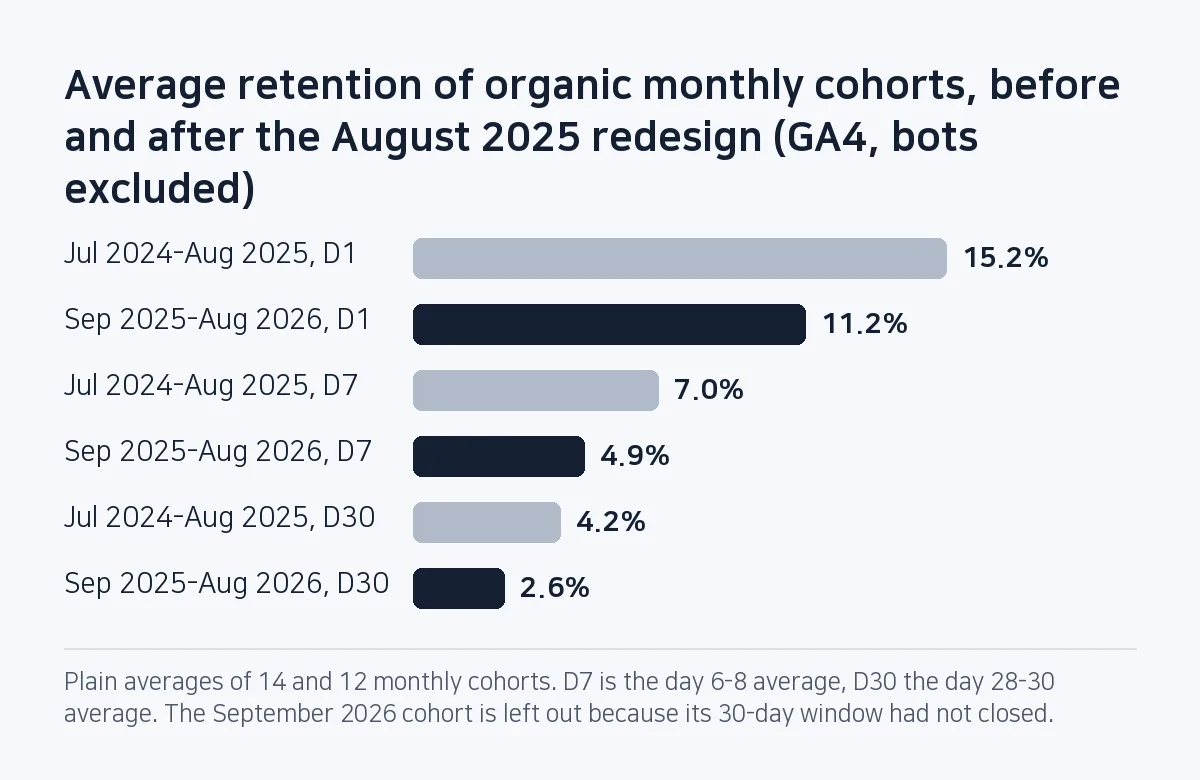
SugarSpeller, our Korean spell-checking app, averaged 780 daily active users in September 2025, the month after its redesign and its highest month of 2025. The release branch for version 1.6.007, which made a chat-style screen the default, was merged on August 18, and 3,053 new users arrived in September, close to twice the June and July numbers. We only saw that they were staying less on October 18, 2026, when we pulled five years of GA4 data. Organic monthly cohorts had gone from 15.2% to 11.2% on D1 (opened again the day after install) and from 4.2% to 2.6% on D30. The timing lines up with the redesign, but this data cannot separate the chat default, the ad changes and the surge of new users as causes.
Sources: the app repository's git history (02cbb15 to 61d6f15, a88ee55, eab1837, cb33385), the GA4 Data API scripts and output files committed with the October 18, 2026 strategy document (data through October 17, 2026), and the app's operations log. Cohort averages were recomputed from those output files on October 29, 2026.
Contents (10)
- 26 months of organic cohorts: D1 from 15.2% to 11.2%
- New users nearly doubled in September, and DAU went up
- Ad changes and a wave of new users landed in the same weeks
- Four things we corrected in the AI-assisted strategy document
- We are not switching the default back yet; a new-install A/B test comes first
- What we added while waiting: a morning quiz notification
- A GA4 cohortSpec and filter JSON for organic cohorts
- Organic users only, and it needs cohorts in the hundreds
- Numbers the notification readout and the default-screen test will log
- Frequently asked questions
26 months of organic cohorts: D1 from 15.2% to 11.2%
We built monthly cohorts by first session date with the GA4 Data API cohort request and kept only users whose first channel was Organic Search. Devices with no brand, OnePlus8 models and sdk_gphone emulators (Play's pre-launch test bots) were filtered out. Plain averages for the 14 months before the redesign and the 12 months after:
| Organic monthly cohorts | Avg size | D1 | D7 (days 6-8) | D30 (days 28-30) |
|---|---|---|---|---|
| Jul 2024 to Aug 2025 (14) | 1,066 | 15.2% | 7.0% | 4.2% |
| Sep 2025 to Aug 2026 (12) | 900 | 11.2% | 4.9% | 2.6% |
Weighting by cohort size gives 15.4% to 11.2% on D1 and 4.3% to 2.6% on D30, so the picture holds. We also checked for a seasonal dip. In 2024 the September cohort's D1 fell to 14.7% and the October cohort was back at 16.3%. In 2025 the numbers were 13.6% in September, 12.3% in October and 12.3% in November, and every cohort through August 2026 stayed between 7.7% and 12.6%.
Weekly cohorts show where the step is. The 11 organic weekly cohorts from the week of June 2 to the week of August 11, 2025 averaged 16.4% on D1 (range 13.4% to 21.7%); the 13 from the week of September 1 to the week of November 24 averaged 12.6% (9.1% to 16.6%). A weekly cohort here is 176 to 423 people, so single weeks swing widely, and we made the call on monthly averages.
New users nearly doubled in September, and DAU went up
For months after the redesign, rising DAU kept the break out of sight; the repository has no record of the post-redesign cohorts being cut separately before October 2026. New users across all channels were 2,304 in August 2025 and 3,053 in September, against 1,381 in June and 1,596 in July. Monthly average DAU rose to 765 in August and 780 in September. It then dropped to 654 in October and kept sliding, from 582 in January 2026 to 408 in September.
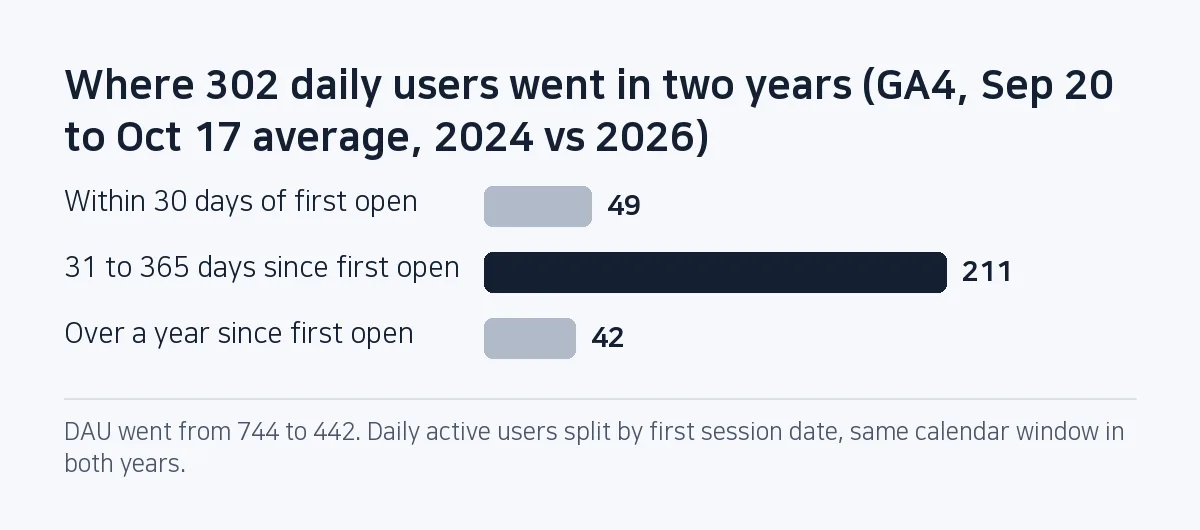
Splitting DAU by first session date shows which users went missing. These are daily averages over the same calendar window, September 20 to October 17, in each year.
| Time since first session | 2024 | 2025 | 2026 |
|---|---|---|---|
| Same day (new) | 43 | 64 | 34 |
| 1-7 days | 24 | 26 | 12 |
| 8-30 days | 43 | 41 | 15 |
| 31-90 days | 87 | 95 | 33 |
| 91-365 days | 253 | 169 | 97 |
| Over a year (1-2 years + over 2) | 293 | 292 | 251 |
| Total DAU | 744 | 688 | 442 |
Each cell is rounded to the nearest user, so a column can be one off from its total. Of the 302 daily users lost between 2024 and 2026, 211 (70%) were people 31 to 365 days past their first session. Same-day new users fell by 9. Users older than a year went from 39% of DAU to 57%, yet their count fell from 293 to 251; the share rose because the younger group emptied out.
In the 2026 window, the 31-365 day group is made up only of people who first opened the app between late September 2025 and mid-September 2026, all of them post-break cohorts. That group fell 62%, from 340 to 130. New users across all channels in the two periods when this group first opened the app fell about 25%, from roughly 20,000 to roughly 15,100 (monthly new users prorated by day). Fewer arrivals cannot account for a 62% drop; the rest is people who came in and stayed less. We did not measure how much retention fell further after day 30.
Ad changes and a wave of new users landed in the same weeks
Version 1.6.007 was built from 27 commits (merges included) between August 7 and 18, 2025, touching 129 files with 6,864 lines added and 2,476 removed. Its first commit, 02cbb15, "ChatGPT-style UI, complete overhaul", is the first commit in this repository with a Claude Co-Authored-By trailer; six commits in the range carry one. One of their subject lines reads "UI/UX perfectly identical to ChatGPT, complete". How this app's commit messages changed over the following year is in A year of AI coding in 701 commits. Neither the commit messages in the range nor the working notes (progress.md) at the release say anything about watching retention or cohorts after shipping.
The screen was not the only change in that release. Three changes are worth setting against the retention data.
- Default screen:
getBoolean("opt.uiMode", true)made chat the default. Earlier versions had no such setting at all, so existing users who updated also opened into the chat screen. - An ad shown when the user exits the app with the back button (83bc49f).
- Chunking, which splits long text into pieces before sending it to the checker (eb5aadc).
A separate hotfix for the app-open ad (a88ee55, version 1.6.008) shipped on August 26, and the surge in new users above fell in the same August and September. Weekly engagement time per user dropped from 377 seconds in the week of August 18 to 297 the next week and 253 by the week of September 8. Active users in those weeks rose from 3,072 to 3,400, though, so that metric mixes the screen change with a different set of users.
Four things we corrected in the AI-assisted strategy document
The break was first written up in a strategy document in commit eab1837 on October 18, 2026. The commit carries a Claude co-author trailer and includes the GA4 analysis scripts and their output files alongside the document. Recomputing from the same output files for this note turned up several things to fix; these are the four largest.
- The document labeled D30 as the day 28-30 average and gave 2.4%. That 2.4% was the average of the single day-30 values; the day 28-30 average is 2.5%. Its range also included the September 2026 cohort. The data ended on October 17, so anyone who joined after September 17 had not reached day 30, and that cohort showed a D30 of 1.0%. Without it the figure is 2.6%.
- The document listed 1.6.007's three changes and the August 26 hotfix, then called them "the only change that coincides with the break." It left out the surge in new users in the same weeks, and it reads as if the bundle were a single candidate cause.
- The document used engagement time per user, 377 to 253 seconds, as evidence of the break. The denominator changed under that metric; the organic cohorts are the cleaner evidence.
- The document said 80 to 97 users a day opened the quiz from a notification between October 9 and 17. The daily values were 70 to 97 (70 on October 13).
None of the four reverses the finding, but item 2 narrowed the candidates to one release when three changes and a wave of new users had landed in the same weeks. The document itself concluded that causation could not be established and left the decision to start a default-screen test to the operator.
We are not switching the default back yet; a new-install A/B test comes first
The fastest response would be to make the older Classic screen the default again. On September 24, 2026 the operations log held the opposite proposal: remove Classic and move everyone to chat. That day's 28-day numbers showed Classic users running 7.6 checks per user against 4.5 for chat, and a return rate of 76% against 64%. In an app whose default is chat, though, Classic users are people who went looking for the switch, so the gap cannot be read as the effect of the screen. Moving existing users, who have had over a year on chat, back again has its own cost.
Comparing before and after on all-channel cohorts was also dropped. All-channel D1 fell as low as 8.0% in August 2023 and recovered to 12.5% to 15.1% in October to December of that year. Paid search brought 77% of new users in 2022 and 42% in 2023, and D1 moved along with that shift in channel mix. Paid (Cross-network) share was similar in 2025 and 2026, at 22% and 23%, but we compared organic users only.
What can separate the causes is an A/B test that gives half of new installs a different default screen. New installs run at about 185 a week, so detecting a 10-point difference needs about 350 per group, and two first-run experiments (judged on November 8 and around November 15) are already splitting those installs. Running three at once would leave all three unreadable, so the plan is to start after November 16. The bar is D7 up 2 points after four weeks.
When you ship a large redesign, cut out the D1 of the cohorts that install from that week on and track it for four weeks. In a month when installs jump, DAU will not show you the regression.
What we added while waiting: a morning quiz notification
Version 1.6.024 started sending a morning spelling-quiz notification on September 26, 2026. Before that, zero users a day opened the quiz from a notification; between October 9 and 17 it was 70 to 97 a day. Returning users per day, with bots excluded, went from 365 in the week of September 7 to 447 in the week of October 12, up 82 or 22%. How much of the 82 the notification caused is not measured yet; an experiment that sends more notifications to one group (qr_extra) reads that out in active days per user on October 31.
The notifications skewed another number. From version 1.6.030, events sent by a background alarm pushed GA4 totalUsers from 1,500 on October 17 to 2,400-2,900 on October 19-22, while activeUsers stayed near 500 (found on October 23). Every DAU figure in this note uses activeUsers. How we filter out test phones and bots is in GA4 said 19 installs yesterday and 8 were real.
A GA4 cohortSpec and filter JSON for organic cohorts
- Send a
runReportwith acohortSpec. Give each cohortdimension: "firstSessionDate"and a one-monthdateRange; setcohortsRangetoDAILY, days 0 to 30,accumulate: false. Dimensions arecohortandcohortNthDay; metrics arecohortActiveUsersandcohortTotalUsers. We sent six months per request. - Filter on first channel and bots with
dimensionFilter.{"andGroup": {"expressions": [ {"filter": {"fieldName": "firstUserDefaultChannelGroup", "stringFilter": {"value": "Organic Search"}}}, {"notExpression": {"filter": {"fieldName": "mobileDeviceBranding", "stringFilter": {"value": "(not set)"}}}}, {"notExpression": {"filter": {"fieldName": "deviceModel", "stringFilter": {"matchType": "CONTAINS", "value": "OnePlus8"}}}}, {"notExpression": {"filter": {"fieldName": "deviceModel", "stringFilter": {"matchType": "BEGINS_WITH", "value": "sdk_gphone"}}}} ]}} - Use day 1 for D1, and the day 6-8 and day 28-30 averages for D7 and D30. Say in the table header which one you used.
- If a cohort's last day plus 30 days falls after the end of your data, leave it out of the D30 average.
- Put each month next to the same month a year earlier, to see whether a September dip happens every year and whether the next month recovers.
- Line up weekly cohort D1 around the date of a large release to see when a break starts. Use the same filter as the monthly cohorts (our weekly script only had the brand filter).
- Pull DAU with both
dateandfirstSessionDate, bucket the gap (same day, 1-7 days, 8-30, 31-90, 91-365, 1-2 years, over 2 years), and compare the same calendar window across years. A request like this is enough:
For each row, bucket (date minus firstSessionDate), sum, and divide by the number of days in the window.{"dateRanges": [{"startDate": "2026-09-20", "endDate": "2026-10-17"}], "dimensions": [{"name": "date"}, {"name": "firstSessionDate"}], "metrics": [{"name": "activeUsers"}], "limit": 250000} - Count users with
activeUsers. If any feature sends events in the background,totalUserswill run high.
Organic users only, and it needs cohorts in the hundreds
Paid cohorts are not in this comparison. Monthly cohorts need a few hundred users before the averages settle. The staged rollout percentage and dates for 1.6.007 are not on record, so we could not confirm why the weekly break shows up in the week of September 1 rather than August 18. The script that split DAU by first session date had no bot filter, so the 34 same-day new users in 2026 may include pre-launch bots. That barely touches the conclusion about the 31-365 day group.
Search interest fell too. On Google Trends (South Korea), the 2026 average for "맞춤법 검사기" (spelling checker) was 38% below the 2025 average (checked October 18, 2026). That is a 2026 trend and cannot explain a step that starts with the September 2025 cohort, and we could not separate how much of it went into later drops such as the July 2026 cohort's D1 of 7.7%.
Numbers the notification readout and the default-screen test will log
At the October 31 qr_extra readout we will look at whether the group with more notifications gains at least 10% in active days per user while uninstalls and notification blocks stay within 2 points. Once the default-screen test starts after November 16, we will log D1, D7, checks in the first seven days, and uninstall rate per group for four weeks. Until those results are in, we will not call the chat screen the cause of the break.
Frequently asked questions
How do I see retention for organic users only in GA4?
Add firstUserDefaultChannelGroup = "Organic Search" to the dimensionFilter of a Data API cohort request. It is based on the first channel, so a user who later returns through an ad still counts as organic.
Why use the day 28-30 average for D30 instead of the day-30 value?
Single days swing with the weekday and small samples. This app's September 2024 organic cohort had a day-30 value of 2.8% and a day 28-30 average of 3.2%. Pick one, name it in the table header, and do not mix them.
Can DAU go up while retention goes down?
Yes. In September 2025 this app took in 3,053 new users and DAU rose to 780, while that month's organic cohort had a D1 of 13.6%, below the year before, and later cohorts did not recover.
This note is written from values SugarMount measured itself; an AI coding agent was used to draft it.
More AX notes
- We built three photo apps before checking the market: this year's new apps had a median of 1,166 installs
- A year of AI coding in 701 commits: from "complete" to cause and verification
- How we shipped four Android apps in 20 days with an AI coding agent
- Pre-gzipping Android assets, measured: zero APK savings, and .pack.gz became .pack with a FileNotFoundException
- A market:// link opens a store chooser on SKT-sold Samsung phones: set the Play package first
- A splash that never moved on: addOnCompleteListener(this) and onStop