We built three photo apps before checking the market: this year's new apps had a median of 1,166 installs
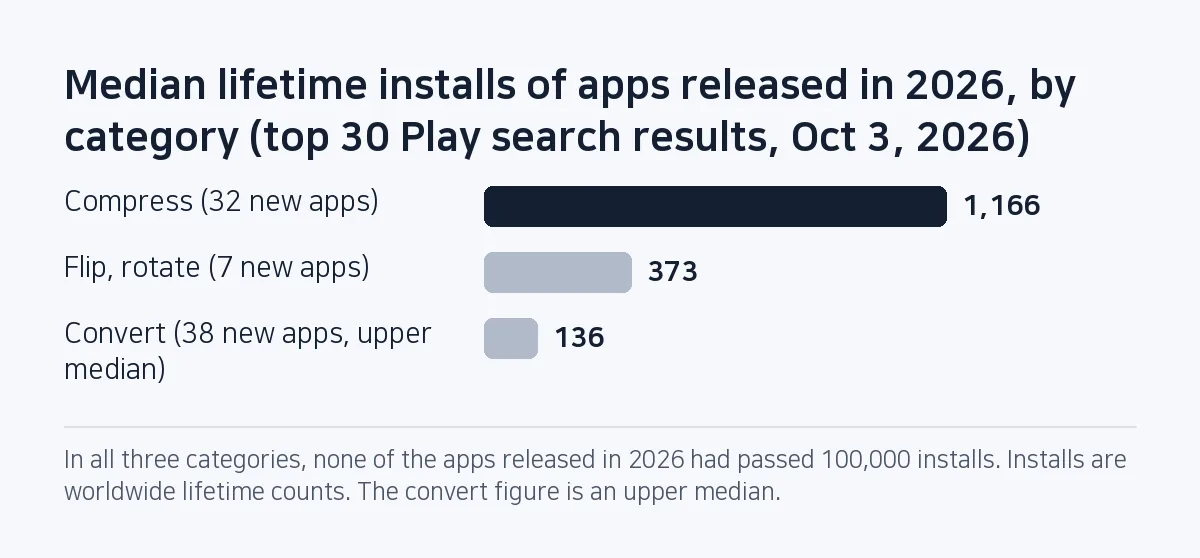
A four-minute scrape of top Google Play search results showed that the 32 photo-compress apps released in 2026 had a median of 1,166 lifetime installs, and we recorded the next 11 planned apps as on hold.
On the morning of October 3, 2026, three of our Android photo apps were already built and uploaded to Play. Compress Image was waiting on the production track; a flip-and-rotate app and an image format converter sat on the internal test track. The operator asked a blunt question that morning: there must be hundreds of AI-built photo apps by now, so had anyone looked at the market? Nobody had. We had the coding agent scrape Play search results, and the first report came back four minutes later. Of 71 compress-and-resize utilities in the top 30 results, 32 had been released in 2026, and their median lifetime installs were 1,166. Our own app was not in the top 30 for any of the nine queries.
Sources: three market research documents in the SugarMount app repository (sugar-utils), written on 2026-10-03 and committed in 7b0e567; the daily ops check of 2026-10-23; git history; and the work session log. Install counts are the worldwide lifetime numbers Play exposes. Checked on October 24, 2026.
Contents (9)
- 26 of the 32 compress apps released this year had fewer than 10,000 installs
- We skipped the check because building looked cheaper than checking
- None of our three starting assumptions was supported by the data
- The agent followed the spec's order, and got the median wrong
- We recorded 11 planned apps as on hold and changed category
- The 15-minute check to run before building
- Why the median is not a forecast, and what the data cannot see
- What we check next
- Frequently asked questions
26 of the 32 compress apps released this year had fewer than 10,000 installs
The compress category came first. Six Korean and three English queries, top 30 results each, gave 103 apps. Keeping only utilities whose titles mention compressing, file size or resizing left 71. Of those, 47 were released in 2025 or 2026, and 32 in 2026.
Those 32 topped out at 73,286 installs. None had reached 100,000, and 26 were under 10,000. One 2026 app that aimed at exactly our pitch, getting photos ready for upload forms, had 0. The top of the list belonged to apps released between 2013 and 2022; the leader had 43.06 million installs.
About ninety minutes later the agent ran the same scrape for the other two categories. Flip and rotate: 46 utilities, only 7 released in 2026, median 373. Format conversion: 71 utilities, 38 from 2026, median 136. In none of the three categories had a 2026 app passed 100,000.
Twenty days later, in the October 23 ops check, the download badges on the public Play pages read 5+ for Compress Image, 1+ for the flip app and 0+ for the converter. Those are 20-day-old apps, so they cannot be lined up against lifetime counts that had up to ten months to build. We read them only as a slow start.
We skipped the check because building looked cheaper than checking
The missing check had a chain of causes behind it.
The lineup was chosen by feature. The product spec revised on September 21 fixed a list of 14 apps and paired each candidate with a "reference app" from one established developer. The same section said, in its own words, that the order was not a download ranking or a revenue forecast.
The reference apps then created an illusion. The reference compress app had 3.89 million installs, and the top of the search results was apps from 2013 to 2022 with millions to tens of millions of installs. If you only look at survivors, "build the same thing, but cleaner" sounds like a plan. Nobody looked at what happened to the apps that arrived this year.
The biggest link was cost: building had become very cheap. The flip-and-rotate app went from its engine commit (7821dbd, September 24, 13:29) to the internal test track (bc0ea78, 20:51) in 7 hours 22 minutes, and the converter reached the internal track at 22:39 the same night (7b9fd55). Leaving out review and store listing work, an app took less than a day, so "ship it and read the numbers" sounded reasonable. The scrape took four minutes.
Underneath all three: the workflow had no gate that said "look at the market before you build". It had a release gate and on-device checks, both described in How we shipped four Android apps in 20 days with an AI coding agent, but nothing upstream of the code.
None of our three starting assumptions was supported by the data
Assumption one: an app that fixes what users hate about the incumbents will get installs. In the newest reviews of the top six compress apps, 127 were rated 3 stars or lower. Keyword tagging put 39 of them under too many ads, 19 under errors, 17 under paid plans and subscriptions, and 12 under output that missed the target size. Our app has no subscription and never writes a file larger than the original. Yet 26 of this year's 32 entrants had not reached 10,000 installs. That figure does not split apps that fixed the complaints from apps that did not, so it cannot refute the assumption directly. It does not support it either. (The top complaint applied to us too: the agent reported that the app-open ad turned on in 1.0.3 on September 23, an operator decision, was the same type. The operator kept it.)
Assumption two came from the operator: merge the three apps into one photo toolbox and people will look for it. The agent searched Play for Korean phrases meaning "photo tool set", "photo utilities" and "image tools", plus "image toolbox" in English. The top results were the default photo app, gallery apps and big photo editors. What the data shows is that general apps own the category-name searches. Play hides search volume, so we do not know how many people search that way.
That afternoon the same question went to document viewers. One developer had three apps: a viewer for HWP files (the Korean word processor format that government offices use) at 436k installs, a PowerPoint viewer at 469k, and an all-in-one office app at 13k. Three apps from one developer, with HWP demand boosted by a policy change, cannot prove that single-purpose beats all-in-one; we treated it as a directional signal. Assumption three, that AI features would make a viewer stand out, was checked against reviews. Of 15,043 Korean reviews of document viewers, 0.36% asked for AI, summaries or translation. That says reviewers rarely ask for it, not that AI cannot set an app apart. Both signals pointed the same way, so the next app became a single-purpose HWP viewer, HWP Viewer SugarDoc.
The agent followed the spec's order, and got the median wrong
The coding agent executed the spec's order as written. While shipping the third app it never suggested looking at the market before the next one. When the operator asked, the agent admitted no market analysis had been done and pointed at the spec's "not a forecast" line.
The numbers had a small error too. Re-reading the scrape script for this note, we found the median computed as s[len(s)//2] on the sorted list s. With 32 values that returns the upper of the two middle values, 1,304. The true median, the mean of 1,028 and 1,304, is 1,166, and that is the number this note uses. The conclusion stands. The flip category has 7 values, so its 373 is exact. The converter category has 38, so its 136 is also an upper median; the value list was not kept, so we could not recompute it, and the true figure is 136 or lower.
We recorded 11 planned apps as on hold and changed category
There were four options on the table.
- Keep building U04 to U14 as planned. If those categories look like the three photo ones, that repeats the same result eleven times. We have not scraped any of them yet, though. The hold was recorded in the backlog on October 4.
- Buy installs with ads. Not until we have measured what one install is worth.
- Unpublish the three apps. Keeping them up costs almost nothing, and the search terms people actually used only show up in Play Console after an app is public. They stay up for a 30-day measurement.
- Move to a category where demand is shifting. From October 2026, Korean government mail systems block .hwp attachments, which pushes documents to the newer HWPX format. One viewer released in May 2026 had already reached 417,538 installs. This is the one we chose.
There were other ways to check the market, too. Paid app-intelligence services show install trends and estimated keyword data, for a subscription fee. Keyword tools can only estimate Play search volume, because Play does not publish it. Skimming the top-chart pages by hand is free, but the chart tops do not show how this year's entrants are doing. The record does not say why a script was chosen. What it does show is that the agent was already working in the repository and the cost was a few minutes.
The HWP viewer was started on October 4, went public on October 10, and shipped with no ad SDK. The difference from the photo apps is that review data and a rendering spike came before the first line of app code. (The rendering spike is written up in Building an Android HWP viewer: rhwp in a WebView, measured on 222 documents.)
Before you build your next app, look at the median installs of this year's entrants in the same category.
The 15-minute check to run before building
This is the order we ran on October 3, plus step 2 (writing the rule first), which we skipped that day. Collection used the Python library google-play-scraper, which reads Play's web pages; it is not an official Google API.
- Write 6 to 9 queries in task words, the way a user would type them. We used six Korean queries and three English ones, such as "compress image" and "image resize kb".
- Write the decision rule before looking. For example: if this year's entrants have a median in the low thousands and none has passed 100,000, do not build a single-feature general utility.
- Collect the top 30 app IDs per query. For each app read lifetime installs, release date, rating count, and whether it has ads or in-app purchases.
- Keep only apps whose title names the same task. We excluded general photo editors, video apps and PDF apps with a deny list. 103 became 71.
- Take the apps released this year and count them, plus their median installs (mean of the two middle values when the count is even), maximum, how many are under 10,000 and how many are over 100,000. Note the release years of the top 10.
- Check whether your own app ID appears anywhere in the results.
- Pull up to 200 of the newest reviews for each of the top six apps, keep 3 stars and lower, and tag them by keyword: ads, payment, errors.
- Search once more with the category name ("photo utilities"). If you are considering an all-in-one app, look at that result first.
Below is a cleaned-up version of the collection code from that day, arranged to follow steps 3 to 6. We have not run this cleaned-up version, only syntax-checked it, so adapt the queries and both regexes to your category. The median comes from statistics.median, the line that prevents the upper-median mistake described above.
import re, statistics, time
from google_play_scraper import search, app

QUERIES = [("사진 용량 줄이기", "ko", "kr"), ("사진 KB 줄이기", "ko", "kr"), ("compress image", "en", "us")]
KEEP = re.compile(r"압축|용량|크기|사이즈|compress|resiz|kb|size", re.I)
DROP = re.compile(r"video|동영상|pdf|editor|편집", re.I)
YEAR, MY_APP = 2026, "com.example.myapp"

ids = set()
for q, lang, country in QUERIES:
    ids |= {r["appId"] for r in search(q, lang=lang, country=country, n_hits=30) if r.get("appId")}
    time.sleep(1)

rows = []
for app_id in sorted(ids):
    try:
        d = app(app_id, lang="ko", country="kr")
    except Exception:
        continue
    time.sleep(0.4)
    name = f'{d.get("title") or ""} {app_id}'
    if not KEEP.search(name) or DROP.search(name):
        continue
    m = re.search(r"\d{4}", d.get("released") or "")   # "Oct 3, 2026" or "2026. 10. 3."
    rows.append((int(m.group()) if m else None, d.get("realInstalls") or 0))

new = [n for y, n in rows if y == YEAR]
print("same-task apps:", len(rows), "| released in", YEAR, ":", len(new))
if new:
    print("median", statistics.median(new), "| max", max(new),
          "| under 10k", sum(n < 10_000 for n in new), "| 100k+", sum(n >= 100_000 for n in new))
print("my app in results:", MY_APP in ids)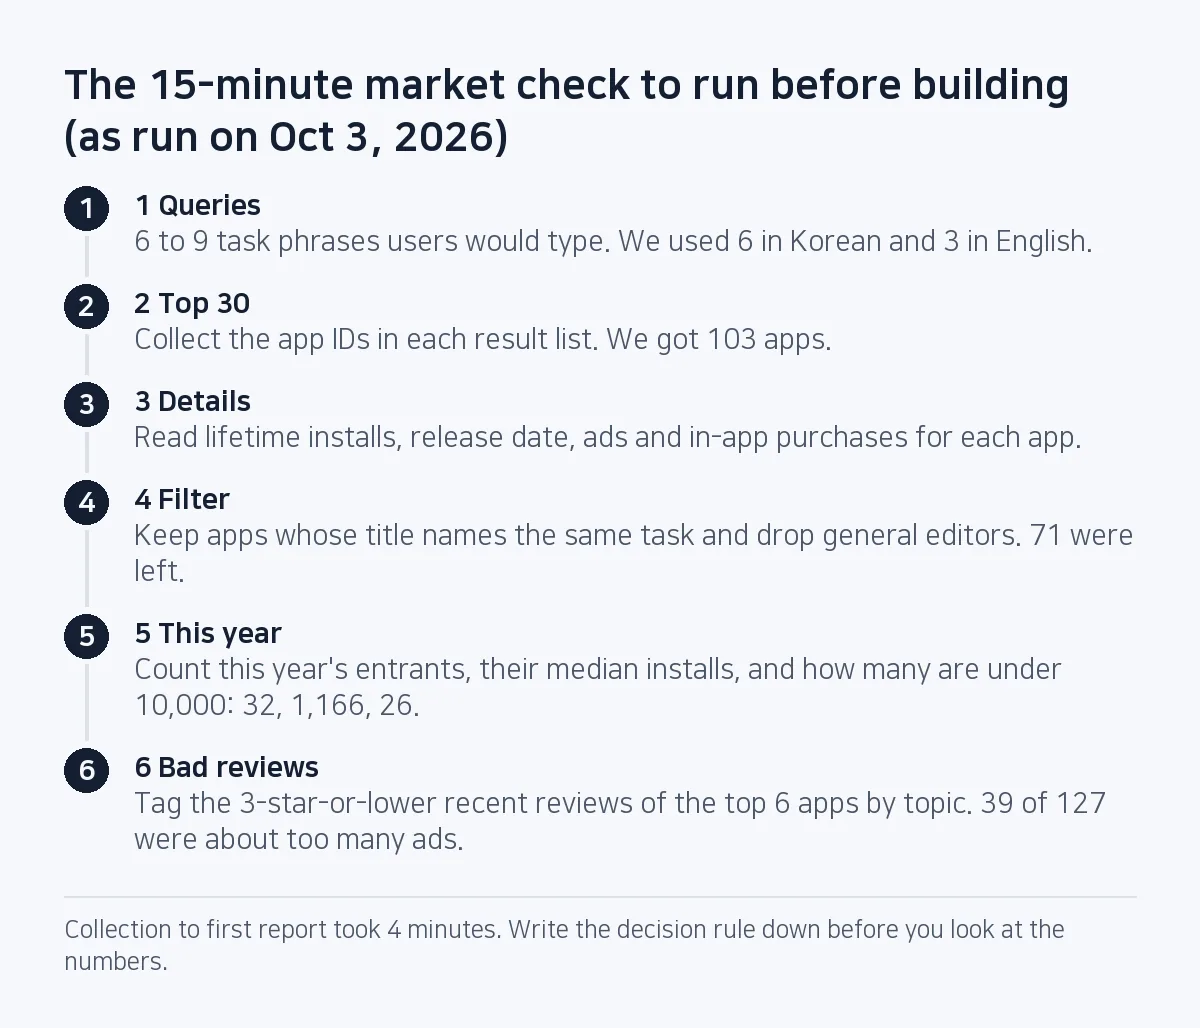
The four minutes cover collection and the first report for one category (09:47 to 09:51 Korea time). Add choosing queries and a person reading the tables against the step 2 rule, and budget 15 minutes.
Why the median is not a forecast, and what the data cannot see
The sample itself leans one way. Only apps in the top 30 for the nine queries got in; this year's apps that never ranked were left out. The median for all same-task apps released this year is probably below 1,166. So 1,166 is the result for this year's apps that made the top of search, and cannot be read as what a well-made app should expect. Even among them, six passed 10,000, the largest at 73,286.
In a category where demand is moving, last year's distribution says little about next month. Document viewers were that case: right after the policy change, new apps were collecting hundreds of thousands of installs.
Installs are worldwide lifetime counts, and rankings come from a logged-out session, so a real user's screen may differ. Review topics were counted with keyword regexes, so one review can land in several topics, and only six apps' newest reviews were read. Apps with an empty release-date field drop out of the yearly count. The library depends on Play's page layout and breaks when that changes.
What we check next
The 30-day measurement for Compress Image ends on November 2, 2026. Impressions, install conversion and the real search terms will decide whether the three photo apps get merged into one. As of October 24, 2026 that merge has not started.
None of the U04 to U14 categories (photo to PDF, video, audio and others) has been scraped yet. Whether the hold is right can only be judged after running the same check on them, and the operator has not formally confirmed the hold. The next scrape runs with the median fixed.
Frequently asked questions
How many installs does a new Android utility app usually get?
In the photo-compress category we scraped on October 3, 2026, the 32 apps released that year that made the top 30 search results had a median of 1,166 lifetime installs. It varies by category, so scrape your own before building.
Can I see Google Play search volume for a keyword?
No. Play does not publish search volume per query. After your app is public, Play Console shows only the search terms that brought users to your own listing.
Does an all-in-one app beat single-feature apps on Play?
Our data showed no sign that it does. A category search like "photo utilities" returned only general apps, and one developer's two single-format viewers had 436k and 469k installs against 13k for its all-in-one app. That is one developer, so we do not treat it as a rule.
This note is written from values SugarMount measured itself; an AI coding agent was used to draft it.
More AX notes
- Daily users rose after the redesign while organic D1 retention fell from 15.2% to 11.2%
- A year of AI coding in 701 commits: from "complete" to cause and verification
- How we shipped four Android apps in 20 days with an AI coding agent
- Pre-gzipping Android assets, measured: zero APK savings, and .pack.gz became .pack with a FileNotFoundException
- A market:// link opens a store chooser on SKT-sold Samsung phones: set the Play package first
- A splash that never moved on: addOnCompleteListener(this) and onStop